


 English
 Español


Every number in this subcategory arrives with a history: who was measured, by whom, with what instrument, and in what year. Before any regional figure is worth reading, that history has to be read first.
In Brief
- Published measurement studies use different landmarks, different instruments, and different recruitment methods, so their averages are not built to be compared against each other.
- Variation within any single studied population is consistently larger than the difference between population averages.
- A mean without a standard deviation and a sample size carries almost no usable information.
- Where regional data is thin, the honest answer is that it is thin — not that a pattern has been found.
There is a version of this subject that circulates as a colored world map, and a version that exists in the published literature. They are not the same subject. The map assigns one number to every country and invites a ranking. The literature offers a scatter of separate studies, run by different research teams, on different groups of men and women, using protocols that were never standardized against one another. Reading the second honestly means giving up most of what the first appears to promise.
That is not a disappointing conclusion. It is the interesting part. The reasons regional comparison is hard are the same reasons body measurement science is worth studying at all: measurement is a practice, not a fact, and small choices in how a study is run move its results more than most readers expect. If you have already read our breakdown of what the largest pooled measurement study actually reported, this article is the frame that sits underneath it — and underneath everything else filed in this section.

Four reasons two studies cannot simply be lined up
Say two research teams publish averages a year apart, one in Europe and one in the Middle East, and the second number is higher. Before that gap means anything about the two populations, four things have to match. In practice, they rarely do.
The landmark. A measurement needs a starting point, and there is more than one defensible choice. Pressing the ruler back to the pubic bone gives a different figure than resting it on the surface of the skin. In the Saudi cohort described below, both were recorded in the same 778 men on the same day — and the two figures differ by 1.81 cm (0.71 in). That single protocol choice produced a larger gap than the one separating that cohort from the pooled international figure.
The instrument and the conditions. Some teams used a rigid rule, others a flexible tape. Some recorded to the nearest millimeter, others to the nearest five. Habous and colleagues noted that their consultations took place in rooms held at a constant 21 °C (70 °F), a detail that reads as fussy until you consider that temperature affects soft tissue and that most studies never report the room at all.
Who was recruited. Clinical samples are not random samples of a country. Men attending a urology clinic in one health system differ from university volunteers in another, who differ again from military conscripts. Habous and colleagues drew their cohort from urology outpatient clinics in Saudi Arabia, where a pre-marital check is a common reason to attend. That is a specific group of men, at a specific life stage, for a specific reason — not a national cross-section. The same caution applies to every sample in the table below, in both directions.
The year. Populations change. Height in many countries rose substantially across the twentieth century as nutrition and childhood healthcare improved, and any body dimension shaped by developmental conditions can shift on the same kind of timescale. Comparing a 1996 sample with a 2015 sample is partly comparing two decades, not two places. Our overview of how body measurements have shifted over time covers that separately.
Table 1 — The same measurement, four different ways of taking it
| Study & year | Sample | Method | Reported mean (SD) |
|---|---|---|---|
| Veale et al., 2015 — pooled review of 17 studies | n = 692 (erect subset of up to 15,521) | Measured by a health professional, standardized procedure; weighted mean across studies | 13.12 cm / 5.17 in (SD 1.66) |
| Veale et al., 2015 — stretched length | n = 14,160 | Stretched, not erect — a different measurement entirely | 13.24 cm / 5.21 in (SD 1.89) |
| Habous et al., 2015 — bone to tip | n = 778, Saudi Arabia, mean age 43.7 | Retrospective urology outpatient cohort; erection induced pharmacologically; room held at 21 °C | 14.34 cm / 5.65 in (SD 1.86) |
| Habous et al., 2015 — skin to tip | The same 778 men | Identical session, identical observers — only the starting landmark changed | 12.53 cm / 4.93 in (SD 1.93) |
Sources: Veale et al., BJU International 2015;115(6):978–986. Habous et al., The Journal of Sexual Medicine 2015;12(6):1402–1406. Figures rounded as published.
Read the last two rows together. Same men, same room, same afternoon — and a difference of 1.81 cm between the two published means, produced entirely by where the ruler was placed. Any regional comparison that does not confirm both studies used the same landmark is comparing methods and calling it geography. Our guide to why measurement technique changes the result works through that in detail.
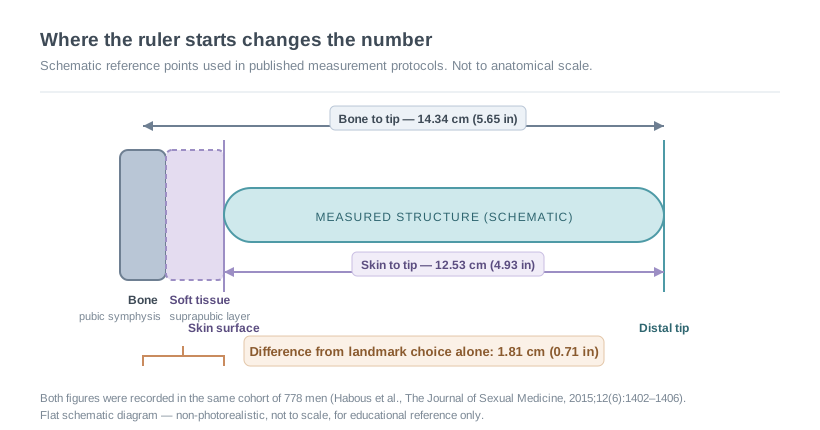
The difference produced by moving a ruler two centimeters was larger than the difference between the two populations being compared.
Within-group variation is always larger than between-group variation
This is the single most useful idea in the subcategory, and it holds across essentially every human body dimension that has been studied at scale. The spread of measurements inside any one population is wider than the gap between one population's average and another's.
The pooled figures make the point without any interpretation. Veale and colleagues reported an erect mean of 13.12 cm with a standard deviation of 1.66 cm. In a distribution of that shape, the middle 90 percent of men fall between roughly 10.4 cm and 15.9 cm (4.09 in to 6.24 in) — a span of about 5.5 cm. The gap between that pooled average and the Saudi cohort's bone-to-tip average is 1.22 cm. The within-group spread is more than four times the between-group gap.
Put visually, the two distributions sit almost on top of each other.
Two published samples, plotted as distributions
Modeled normal curves using each study's published mean and standard deviation. The shaded region is the range where both samples contain men.
Modeled from the published means and standard deviations, the two curves share roughly 73 percent of their area. Draw one man at random from each sample and the man from the higher-average sample is the taller measurement about 69 percent of the time — which means the other outcome happens close to a third of the time. Around 23 percent of men in the lower-average sample measure above the average of the higher one.
Those three numbers are the honest translation of "one region's average is higher." Not a ranking. Two heavily overlapping spreads, in which the origin of any individual man tells you very little about his measurement, and his measurement tells you nothing at all about his origin.
By the Numbers
1.81 cm
Difference between two averages taken from the same 778 men, caused only by the choice of landmark
692
Men behind the widely cited erect-length figure from a review that screened 16,678 publications
~73%
Modeled overlap between the two distributions plotted above
17
Studies that met the review's inclusion criteria, out of thousands screened
The sample size hiding inside the headline number
Pooled reviews are often described by their largest figure, and the largest figure is rarely the one people quote it for. Veale and colleagues screened 16,678 publications and kept 17 that met their criteria: measurement taken by a health professional using a standard procedure, at least 50 participants, and exclusion of men presenting with a size concern or a relevant condition. Those are careful criteria. But the number of participants behind each nomogram varies enormously. Stretched length rests on 14,160 men. Erect length rests on 692. Erect circumference rests on 381.
A figure built on 692 men, drawn from a handful of separate studies, is a reasonable estimate. It is not a global census, and it cannot be sliced by region without the subgroups becoming too small to say anything. The review's own authors were explicit that the available literature offered little high-quality data on different ethnic groups — a limitation the follow-up Saudi study opened by restating. When later writers turn that pooled figure into a per-country map, they are inventing precision the source never contained. That specific failure is unpacked in our companion piece on the gaps in the most-cited size study.
What actually moves a population average
Where a genuine difference between two samples does appear, geography is one candidate explanation among many — and usually not the first one to reach for.
Age is a straightforward example. The Saudi cohort had a mean age of 43.7 years, with participants ranging from 20 to 82. Studies of young adult volunteers draw from a much narrower band. Habous and colleagues reported weak negative correlations between age and both of their length measurements, which means two samples with different age profiles will differ slightly before any other factor is considered.
Body composition is another. The same study reported a mean body mass index of 29.09 and a weak negative correlation between BMI and the skin-to-tip measurement — but not the bone-to-tip measurement. The suprapubic fat pad sits between the skin surface and the bone, so it changes one figure and not the other. A population difference in average body composition would therefore show up in a study using one landmark and vanish in a study using the other.
Then there are the developmental factors that shape any body dimension over a lifetime: childhood nutrition, healthcare access, and the broad conditions that drove twentieth-century height increases in many countries. These operate at the level of populations and generations, and they are entangled with geography without being caused by it. A difference between two national samples measured in different decades may reflect the decades.
Research has explored a genetic contribution to body proportions generally, and there is no reason to assume body dimensions are exempt. But the published measurement literature is not built to separate that contribution from nutrition, age, recruitment and protocol. Noting a tendency in the data is one thing; attributing it to ancestry is a claim the available studies cannot support, and a claim with a long record of being made badly. Our overview of what is known about inheritance and body size covers the current state of that question.
Did You Know?
The Saudi study reports the temperature of its consulting rooms — a constant 21 °C (70 °F). Most published measurement studies never mention the room at all. When a research team documents a variable that others ignore, it is usually because they concluded it mattered enough to control, which is itself information about how much unreported variation may sit inside the studies that stayed quiet about it.
Self-report data cannot carry a regional comparison
Some widely circulated country tables are assembled from surveys in which participants measured themselves and submitted a figure. Those datasets are large, cheap to gather, and unusable for this purpose.
The problem is not that self-reported numbers are inaccurate in general — it is that the direction and size of the error may differ systematically between groups. Reporting norms, the social weight attached to the subject, the wording of the question in translation, and who chooses to answer an online survey at all can all vary between countries. Two self-report samples can differ by a full centimeter without a single body differing at all. The studies that support the figures in this subcategory share one requirement: measurement was taken by a trained observer using a stated procedure.
Where the data is genuinely thin
An honest account of this subcategory has to include the empty spaces. Whole regions have no published study meeting basic quality criteria. Several of the studies that do exist were designed for clinical purposes — establishing a reference range for counseling men worried about size — rather than for cross-population comparison, and their authors say so. Female measurement research faces the same constraints with a thinner literature still, as our review of the documented range in published female anatomy research sets out.
The absence of data is not evidence of anything. It is an absence. Where a country appears on a circulating map with a confident figure and no study behind it, the figure was estimated, interpolated, or invented. Articles in this section will name what is known, name what is not, and leave the gaps visible rather than filling them.
Terms used in this article
- Mean
- The arithmetic average of all measurements in a sample. On its own it describes the center of a group and nothing about its spread.
- Standard deviation (SD)
- A measure of how widely values scatter around the mean. In a bell-shaped distribution, roughly 68 percent of a sample falls within one SD of the mean and about 95 percent within two.
- Nomogram
- A chart that converts a measurement into a percentile position within a reference sample.
- Percentile
- The share of a reference sample falling below a given value. A measurement at the 60th percentile is above 60 percent of that sample — that sample, not all men everywhere.
- Pooled estimate
- A single figure calculated by combining several separate studies, weighted by their sample sizes.
- Distribution overlap
- The share of area two distributions share. High overlap means the two groups contain largely the same range of values despite different averages.
The frame for everything that follows
Regional measurement data can tell you what a particular research team found, in a particular group of participants, using a particular protocol, in a particular year. Read that way it is genuinely interesting — a record of how a difficult thing gets measured and how much the measuring itself shapes the answer.
What it cannot do is rank populations, describe a country, or say anything at all about an individual reader. The distributions overlap too heavily and the methods differ too much. Every article filed under this heading will state its sources, its sample sizes and its standard deviations, and will say plainly where the evidence runs out. That is the whole method, and it comes before the numbers every time.
Common questions about regional measurement data
Sources
- Veale D, Miles S, Bramley S, Muir G, Hodsoll J. Am I normal? A systematic review and construction of nomograms for flaccid and erect penis length and circumference in up to 15,521 men. BJU International. 2015;115(6):978–986. Systematic review and nomogram construction in BJU International
- Habous M, Tealab A, Williamson B, et al. Erect penile dimensions in a cohort of 778 Middle Eastern men: establishment of a nomogram. The Journal of Sexual Medicine. 2015;12(6):1402–1406. Middle Eastern cohort nomogram study in The Journal of Sexual Medicine
- Veale D, et al. Record for the systematic review in the U.S. National Library of Medicine database. PubMed entry for the 2015 systematic review
Disclaimer
- All content on this website—including articles, educational materials, and interactive calculators—is for informational, educational, and entertainment purposes only. The calculations, percentiles, and outputs generated by tools on this site are based on general statistical data and mathematical models; they do not constitute medical data, a clinical assessment, or a diagnosis.
- Nothing contained on this website is a substitute for professional medical advice, diagnosis, or treatment. Always seek the guidance of a qualified healthcare professional or urologist with any questions you have regarding physical development, anatomy, or health conditions. Reliance on any information or tools provided by this website is solely at your own risk.


