


 English
 Español


Male Percentile Estimator: Complete User Guide — How to Measure, Enter, and Interpret Your Result
- Subtitle: Position, Not Verdict
- Excerpt: Most men who look up a percentile walk away with the wrong idea — not because the arithmetic is off, but because a number without its curve behind it looks like a ranking. This guide covers the measurement protocol that research actually uses, why flaccid, stretched and erect readings produce three different answers for the same man, and how far a single centimetre of technique error moves the result. The tool is the small part. Reading it properly is the rest.
A percentile is a position in a published distribution, not a verdict on a body. This guide covers the measurement protocol, the difference between flaccid, stretched and erect inputs, and what the resulting number can and cannot tell you.
By Adrian Lowe · Reviewed against GS-001 and GS-003 in the Study Database · Educational reference tool
In brief
- The estimator places a single measurement inside the pooled distribution published by Veale and colleagues in 2015, a meta-analysis of 17 clinician-measured studies covering 15,521 men (GS-001).
- Flaccid, stretched and erect measurements are three separate distributions. The same man produces three different percentile positions, and they are not interchangeable.
- A measurement error of one centimetre near the middle of the curve moves the result by roughly 20 to 25 percentile points. Technique matters more than most users expect.
- The curve is always shown alongside the number, because the number alone hides how tightly the population clusters around the middle.
Quick start
Before you enter anything
What you need
- A rigid ruler with millimetre markings, not a flexible tape, for length.
- A soft tape or a strip of paper and a ruler, for circumference.
- A warm room. Temperature changes flaccid measurements considerably.
- Two or three repeat readings taken on different days.
Do and do not
- Do press the ruler firmly against the pubic bone, the way researchers do.
- Do measure along the top surface, from the pubic bone to the tip.
- Do not compress the fat pad differently between readings — pick one pressure and keep it.
- Do not mix a length taken one way with a comparison group measured another way.
Full protocol: How to Measure Penile Size Accurately: Tools, Technique and Consistency Explained.
Percentile Estimator
Enter a length, a circumference, or both. Every result is expressed as the share of the measured population that recorded a lower value on the same metric.
Units
Length
Circumference
Reference data: Veale D, Miles S, Bramley S, Muir G, Hodsoll J. Am I normal? A systematic review and construction of nomograms for flaccid and erect penis length and circumference in up to 15,521 men. BJU International, 2015 (GS-001). Educational population reference only. Not a medical measurement and not a diagnostic instrument.
How to read the result
The estimator returns one sentence: a share of the measured population recorded a lower value than the number entered. That sentence is doing less work than it appears to. It describes a position in one dataset, collected with one protocol, from a pool of men who agreed to be measured in a clinical setting. It says nothing about the person who entered the number.
Three points make the difference between reading a percentile well and reading it badly.
1. The middle of the curve is crowded
The pooled distributions in GS-001 have narrow standard deviations. For erect length, roughly two thirds of the measured sample fell within about 1.7 cm (0.7 in) of the pooled mean of 13.12 cm (5.17 in). A shift of a single centimetre inside that crowded middle band moves a result across a large stretch of the percentile scale, while the same centimetre out at the tails barely moves it at all. This is why the curve is drawn every time. A percentile of 35 and a percentile of 65 look far apart as numbers and sit close together as bodies.
2. Percentiles are not evenly spaced measurements
Moving from the 50th to the 60th percentile is a smaller physical distance than moving from the 85th to the 95th. The scale compresses in the middle and stretches at the edges. Reading the horizontal axis on the chart — the actual centimetres — gives a truer picture than reading the percentile figure on its own.
3. One measurement is a sample of one, taken once
Research protocols use trained measurers, standardised conditions and repeated readings. A single self-measurement carries far more variation than that. Treating the output as a fixed personal statistic overstates what one reading can support. Taking three readings across different days and entering the middle value gives a more stable position.
Callout
The distribution is the answer; the percentile is a summary of it. A percentile figure without the curve behind it invites a reader to imagine a ranking. The curve shows what is actually there: a dense cluster of men separated by a few millimetres, with thin tails at either end.
Which measurement should you use?
Flaccid, stretched and erect are three distinct research measurements with three distinct distributions. Entering an erect value against a stretched distribution, or the reverse, produces a percentile that means nothing. The estimator keeps them separate for that reason.
- Flaccid length is the least stable of the three. Temperature, recent activity and time of day all move it. Research uses it because it is quick to standardise in a clinic, not because it predicts anything reliably.
- Stretched length is the measurement most often used in clinical research, because it can be taken consistently without arousal. It correlates reasonably with erect length but is not a substitute for it.
- Erect length has the smallest research sample of the three in GS-001, since far fewer studies measured it under clinical conditions. Its distribution rests on a narrower evidence base than the stretched figures do.
Table 1 — Pooled reference values used by the estimator (GS-001, Veale et al. 2015)
| Measurement | Mean | 5th percentile | 50th percentile | 95th percentile |
|---|---|---|---|---|
| Flaccid length | 9.16 cm (3.61 in) | 6.58 cm (2.59 in) | 9.16 cm (3.61 in) | 11.74 cm (4.62 in) |
| Stretched length | 13.24 cm (5.21 in) | 10.13 cm (3.99 in) | 13.24 cm (5.21 in) | 16.35 cm (6.44 in) |
| Erect length | 13.12 cm (5.17 in) | 10.39 cm (4.09 in) | 13.12 cm (5.17 in) | 15.85 cm (6.24 in) |
| Flaccid circumference | 9.31 cm (3.67 in) | 7.83 cm (3.08 in) | 9.31 cm (3.67 in) | 10.79 cm (4.25 in) |
| Erect circumference | 11.66 cm (4.59 in) | 9.85 cm (3.88 in) | 11.66 cm (4.59 in) | 13.47 cm (5.30 in) |
Pooled means from Veale et al. (2015), BJU International. Percentile positions are calculated from the pooled means and standard deviations under a normal-distribution assumption, which is the same assumption the published nomograms rest on. Imperial conversions rounded to two decimal places.
By the numbers
Measurement accuracy changes the answer more than most users expect
Most people using this tool are measuring themselves, without training and without a second reader checking the technique. That is worth stating plainly, because the effect on the output is large.
The fat pad above the pubic bone is the usual culprit. Research protocols call for the ruler to be pressed firmly against the bone, which removes a variable amount of soft tissue from the reading. Press lightly and the number shrinks; press hard and it grows. The gap between a light press and a firm one is often more than a centimetre, and that centimetre is worth roughly a quarter of the whole percentile scale near the middle of the curve.
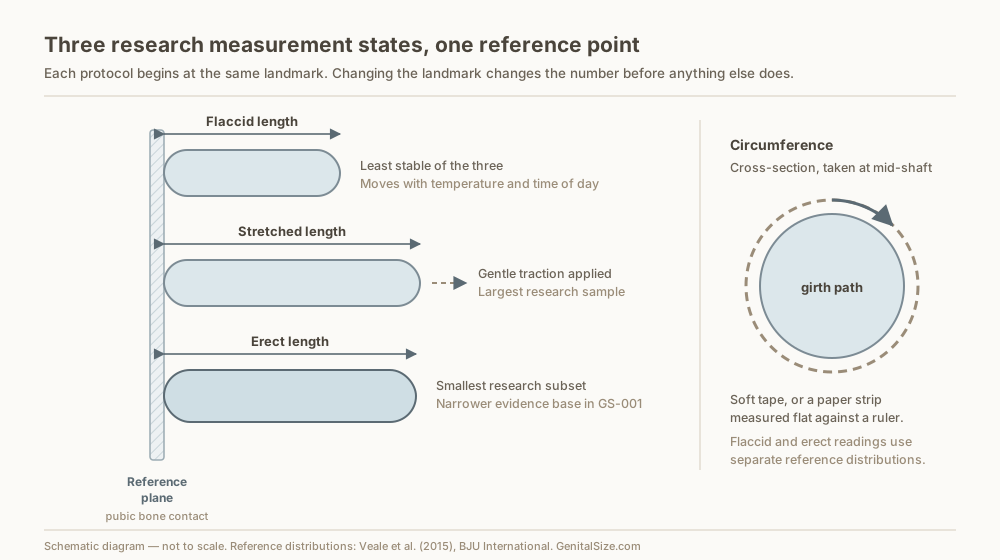
Table 2 — What a measurement error does to an erect-length result near the middle of the distribution
| Entered value | Difference from the pooled mean | Population share below |
|---|---|---|
| 12.1 cm (4.76 in) | −1.0 cm | 27% |
| 12.6 cm (4.96 in) | −0.5 cm | 38% |
| 13.1 cm (5.16 in) | at the mean | 50% |
| 13.6 cm (5.35 in) | +0.5 cm | 61% |
| 14.1 cm (5.55 in) | +1.0 cm | 72% |
Calculated from the GS-001 pooled erect-length mean of 13.12 cm and a standard deviation of 1.66 cm. A single centimetre spans about 45 percentile points across this range — which is why the measurement protocol carries more weight than the arithmetic.
Two related pieces on method are worth reading before trusting any single reading: Same Bodies, Different Numbers: How Study Design Shapes What Research Reports and Cutting Through Data Smoke: How to Read Body Size Research Without Being Misled.
What your result does not mean
This section is not a formality. The output of this tool is regularly over-read, so the boundaries are worth setting out explicitly.
- It is not a medical assessment. Nothing here evaluates health, function or development. This page offers no diagnosis, no screening and no treatment guidance of any kind. Questions about your body belong with a qualified clinician.
- It is not a quality indicator. The distribution describes dimensions. It carries no information about function, satisfaction, fertility or partner experience. Published work on partner perception and size anxiety consistently finds a wide gap between self-assessment and reported partner experience — see Partner Perception and Size Anxiety.
- It is not a comparison to any specific individual. The reference group is a pooled clinical sample from studies published up to 2015, weighted towards the regions where those studies were conducted. It is not your city, your age group or anyone you know.
- It is not a ranking, and higher is not an outcome. The curve has two tails and no preferred direction. Positions above and below the middle are equally ordinary features of any distribution.
- It is not fixed. Change the measurement state, the pressure, the room temperature or the day, and the number changes. What moved was the reading, not the body.
A percentile answers one narrow question: how many men in this particular dataset recorded a smaller number. It was never designed to answer any of the questions people actually bring to it. On reading population data
The study behind the tool
The estimator runs on GS-001: Veale and colleagues' 2015 meta-analysis in BJU International, which pooled 17 studies covering up to 15,521 men and produced the nomograms that most reference tools have used ever since. Its main strength is the measurement standard — every included study used clinician measurement rather than self-report, which removes the largest known source of inflation in size data.
Its limits are equally documented. The pooled sample draws unevenly across regions, the erect-length subset is much smaller than the stretched-length subset, and the studies span several decades of differing protocols. Our full critical summary sets this out in The Problems With the Number: Why 5.17 Inches May Not Be Your Average, alongside the data summary in What the Numbers Actually Say.
A later analysis, GS-003 (Mostafaei et al., 2025, Urology Research and Practice), pooled 33 clinician-measured studies covering 36,883 men and grouped the results by World Health Organization region. Its overall pooled figures land close to GS-001 — flaccid length 9.22 cm (3.63 in), stretched length 12.84 cm (5.06 in), erect length 13.84 cm (5.45 in) — but it reports meaningful regional differences, with the largest pooled stretched length recorded in the WHO Region of the Americas at 14.47 cm (5.70 in). GS-003 is not used for the percentile calculation here, because it does not publish the full percentile curves that a distribution tool requires. It is the better reference for regional questions, covered in What Regional Body Measurement Data Can — and Cannot — Tell Us.
Common questions
Sources
- GS-001 — Veale D, Miles S, Bramley S, Muir G, Hodsoll J. Am I normal? A systematic review and construction of nomograms for flaccid and erect penis length and circumference in up to 15,521 men. BJU International, 2015;115(6):978–986. Primary reference distribution for this tool. Site summary.
- GS-003 — Mostafaei H, Mori K, Katayama S, et al. A Systematic Review and Meta-Analysis of Penis Length and Circumference According to WHO Regions. Urology Research and Practice, 2025;50(5):291–301. doi:10.5152/tud.2025.24038. Supplementary regional context; not used in the percentile calculation.
- Measurement protocol reference — How to Measure Penile Size Accurately: Tools, Technique and Consistency Explained.
- Full entries for both studies are held in the GenitalSize Study Database.
Related reads
Educational reference only. This calculator is a population reference tool built on published research. It is not a medical measurement, not a diagnostic instrument, and not a substitute for professional advice. Results are estimates derived from pooled study data and carry all the limits of that data.
