


 English
 Español


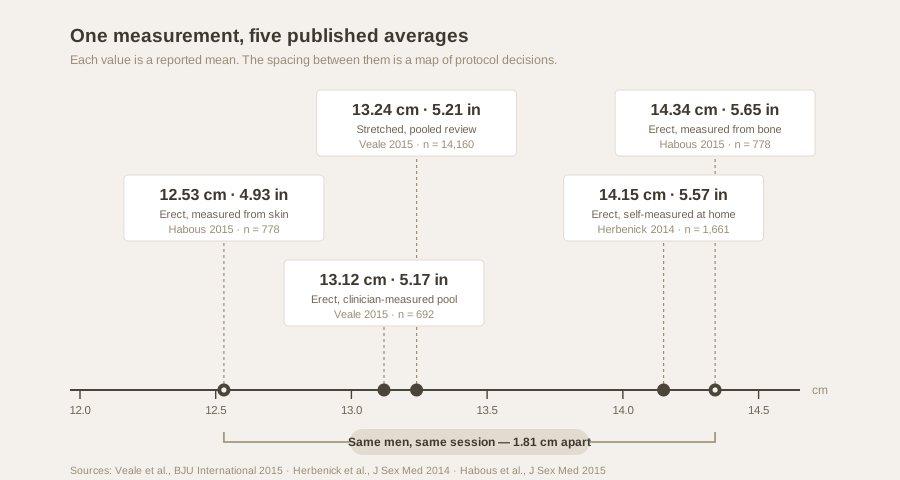
In 2015, a research team at King's College London pooled measurements from up to 15,521 men across sixteen countries and reported a mean erect length of 13.12 cm (5.17 in). A year earlier, an Indiana University team had published a figure from 1,661 American men: 14.15 cm (5.57 in). A centimetre apart. Both peer-reviewed. Both still cited today.
The instinct is to pick a winner. Someone must have got it wrong, or the two groups of men must simply have been different. Neither turns out to be the useful answer. The gap is almost entirely a story about how the measuring was done — who held the ruler, where they started it, what state the body was in, and which men agreed to be counted in the first place. Once you can see those decisions, a disagreement between studies stops being confusing and starts being informative. Our breakdown of the 15,521-man pooled analysis covers what that study found; this article is about why it found something different from its neighbours.
The best analogy is a recipe passed between kitchens. Ten cooks make the same cake from the same card, but one scoops flour and another spoons it, one uses a fan oven and another doesn't, one weighs and the rest use cups. The cakes come out different. Nobody lied about the recipe. The recipe just wasn't specific enough to produce the same cake twice.
Two studies, two numbers, one gap
Start with what each team actually did, because the designs were not variations on a theme. They were different kinds of research answering slightly different questions.
Veale and colleagues, publishing in BJU International, did not measure anyone. They ran a systematic review — a structured search of the published literature with the inclusion rules written down in advance — and pooled the results into nomograms, which are percentile charts that let a single measurement be placed against a distribution. Their headline eligibility rule did the heavy lifting: measurement had to be taken by a health professional using a standard procedure, with at least 50 participants per sample. Self-measured data was out. Samples of men presenting with concerns about size, or with erectile difficulty, prior surgery or congenital differences, were excluded.
Herbenick and colleagues, publishing in the Journal of Sexual Medicine, ran a prospective study — data collected forward in time for a purpose decided beforehand — of men who measured themselves in order to receive a condom fitted to their dimensions. Every participant had a practical reason to be accurate: a bad measurement meant a condom that didn't fit. Most measured alone, using manual stimulation to become erect.
Two designs, two populations of participant, two sets of hands on the ruler. The centimetre between them was earned honestly.
Table 1 — The same measurement, three study designs
| Veale et al., 2015 | Herbenick et al., 2014 | Habous et al., 2015 | |
|---|---|---|---|
| Design | Systematic review and pooled analysis | Prospective, self-measured | Retrospective single-centre cohort |
| Who measured | Health professionals (a study inclusion rule) | The participants themselves, at home | Specialist clinicians, 21 °C (70 °F) room |
| Sample | Up to 15,521 pooled; erect length from 692 | 1,661 men ordering fitted condoms | 778 urology outpatients, Saudi Arabia |
| Erect length reported | 13.12 cm (5.17 in), SD 1.66 | 14.15 cm (5.57 in), SD 2.66 | 12.53 cm skin-to-tip / 14.34 cm bone-to-tip |
| Main limitation named by the authors | Few erect measurements; volunteer bias possible | Self-report; recruitment through a product order | Single centre; clinic population |
Figures as reported in each publication. SD = standard deviation.
The measuring cup problem
Here is the finding that reframes the whole debate. A team working in Saudi Arabia measured 778 men and recorded erect length two ways in the same session, on the same body, with the same clinician. Measured from the suprapubic skin — the surface, where most people would naturally start — the mean was 12.53 cm (4.93 in). Measured from the pubic bone, with the overlying tissue compressed, the mean was 14.34 cm (5.65 in).
That is a difference of 1.81 cm (0.71 in), produced by nothing but where the ruler was placed. It is nearly twice the gap between the two studies people argue about.
The same paper contains a second lesson hiding inside the first. Body mass index showed a weak negative correlation with the skin-to-tip figure but not with the bone-to-tip figure. The tissue in front of the bone varies between men; measure from the surface and you are partly measuring that tissue. Measure from the bone and you are not. Two protocols, two different quantities, both truthfully labelled "length." Our guide to measurement technique and consistency works through the practical version of this.
What the reported state actually means
Anthropometric studies of this region report up to three states, and they are not interchangeable. Flaccid measurements are the most sensitive to conditions in the room — temperature and recent activity both matter, which is why careful protocols specify a climate-controlled setting. Stretched measurements apply gentle traction and were adopted partly because they are repeatable without inducing an erection. Erect measurements answer the question most readers care about and are the hardest to collect.
The pooled 2015 analysis illustrates the cost of that difficulty. Stretched length came from 14,160 men, flaccid length from 10,704 — but erect length came from just 692, and erect circumference from 381. The famous sample size of 15,521 does not stand behind the famous number. The authors named this in their own limitations, alongside the observation that stretched length varied more between studies than anything else they examined.
Induction method matters too. Some clinical studies produce an erection pharmacologically, in a controlled room, with a specialist measuring. The 2014 self-measurement study found that how a man became erect appeared to be associated with the dimensions he recorded. Same body, different route to the measurement, different number.
The difference produced inside one study, by ruler placement alone, was larger than the difference between the two studies everyone argues about.
Who ends up being measured
Every study has a doorway, and the shape of that doorway decides who walks through. The pooled review excluded men attending clinics with a complaint about size — a defensible choice, since including them would drag the average down for a reason unrelated to the general population. But it is still a choice, and it shifts the result. The 2014 study recruited men who had gone out of their way to order a fitted condom, which selects for a particular kind of confidence and a particular kind of engagement with the subject. The Saudi cohort came from urology outpatient clinics, which is a clinical population rather than a random slice of the country.
None of these is the general population, because there is no practical way to obtain one. You cannot knock on 10,000 doors and take this measurement. Researchers work with volunteers, and volunteers differ from non-volunteers — the review's authors raised this possibility about their own dataset. It is a rare and welcome thing to see a research team argue against the strength of their own headline. Our companion piece on who was and wasn't counted in that dataset follows the recruitment question further.
A short vocabulary for reading results
Research writing is not deliberately opaque, but it is compressed. Five terms will carry a reader through almost any paper in this field.
Editorial glossary
- Mean and median
- The mean is the arithmetic average. The median is the middle value once everything is lined up in order. They separate when a distribution is lopsided, so a paper reporting both is telling you something a paper reporting one is not.
- Standard deviation (SD)
- A measure of spread. Roughly two-thirds of a bell-shaped distribution sits within one SD either side of the mean. The 2015 pooled figure carried an SD of 1.66 cm; the 2014 self-measured figure, 2.66 cm. The wider spread is itself a clue about measurement conditions.
- Confidence interval
- The range within which the true value plausibly sits, given the sample. A wide interval is an honest admission that the sample was small or noisy. Read it before the headline figure, not after.
- p-value
- The probability of seeing a result at least this striking if there were genuinely no relationship. A small p-value says a pattern is unlikely to be a fluke. It says nothing about whether the pattern is large enough to matter.
- Effect size
- How big the relationship is. In the Saudi cohort, the association between body mass index and skin-to-tip length reached a very small p-value while the correlation itself, r = −0.283, was weak. Real, and modest. Both facts belong in the sentence.
That last pair is the one most often mangled in reporting. A large sample can drive the p-value down to a vanishing number while the underlying relationship stays too small to notice in any individual case. "Statistically significant" is a statement about confidence, not about magnitude. Anyone who internalises that single distinction is better equipped than most people writing headlines about research.
Two published distributions, drawn to scale
Modelled from each study's reported mean and standard deviation. The overlap is the point.
Drawn side by side, the two curves say something the two headline numbers hide. They overlap across almost their entire range. The centimetre separating the means is small next to the spread within either sample, which is the ordinary condition of human measurement and the reason a single average makes such a poor yardstick for any individual.
How the study was built
A few design labels come up repeatedly, and they are simpler than they sound.
Prospective studies decide what to collect and then collect it. Retrospective studies work backwards through records gathered for another purpose. Prospective is generally cleaner, because the protocol was fixed before anyone knew the answer; retrospective is often the only way to assemble a large sample affordably, which is what the Saudi team did with 778 clinic records.
Single-centre studies run in one place, with one team, and usually one protocol. That consistency is a strength — the measurement error is at least uniform — and a weakness, since one clinic's patients are not the world. Multi-centre work buys breadth at the cost of protocol drift between sites.
Then there is the design that dominates medical research and barely appears here at all. A randomised controlled trial assigns participants to conditions by chance, which is how researchers establish that a treatment caused an outcome. You cannot randomly assign a body dimension. Descriptive anthropometry is observational by necessity — it describes what is there. That is not a weakness in the field, but it does mean the quality levers are different. Where trials rely on randomisation to control bias, measurement studies rely on a tight protocol and honest recruitment. When you assess a study in this field, those two things are what you are assessing.
What the published record cannot tell you
A literature is not a neutral mirror. Journals have historically preferred results that show something over results that show nothing, so findings that reach conventional significance are likelier to be written up, submitted and accepted than findings that do not. Studies that never make it into print are sometimes described as sitting in the file drawer, and a review can only pool what was published. This is worth stating plainly without sliding into cynicism: it means the published average is assembled from a sample of studies, not from all studies ever conducted, and reviews handle it by declaring their search terms and inclusion rules so that others can check the boundary.
Language is another quiet filter. A review searching English-language publications will under-represent research from countries that publish elsewhere, which matters a great deal for a field making cross-population comparisons. And there is the practical constraint running through everything above: clinician-measured erect data is expensive, slow and awkward to collect, so there is far less of it than of any other measurement. Scarcity, not disagreement, is the honest description of much of this literature. For a broader treatment of these pitfalls, see our guide to reading body size research without being misled.
Did you know?
The most-cited erect measurement in this field is routinely reported as coming from a study of 15,521 men. That total is the pooled figure across all measurements in the 2015 review. The erect length nomogram itself was built from 692 men, and the erect circumference nomogram from 381 — a detail the authors stated openly in their limitations, and one that almost every summary of the paper leaves out.
Five questions to ask of any number
None of this requires statistical training. It requires a habit: before accepting a figure, ask what produced it. The checklist below travels well beyond this subject — it works equally on nutrition claims, sleep statistics and anything else reported as a single tidy average.
Reader's toolkit
Before you accept an average
- Who measured? A trained observer following a written protocol, or the participant at home?
- Measured from where? Surface or bone, and was the starting point defined in the paper?
- Which state, and under what conditions? Flaccid, stretched or erect — and was the room temperature specified?
- How did participants get there? A clinic queue, an advertisement, a product order? Who was excluded, and why?
- How many contributed to this specific figure? Not the study's headline total — the number behind the number you are reading.
Worth doing: read the methods section before the abstract; check the standard deviation alongside the mean; treat a study's own limitations paragraph as its most trustworthy passage.
Worth avoiding: comparing figures from two studies without checking they measured the same way; reading a p-value as a measure of size; treating a population average as a personal benchmark.
Both numbers are right
Return to the two studies. One reports what trained clinicians recorded under standardised conditions in samples chosen for protocol consistency. The other reports what a large group of motivated men recorded about themselves, at home, for a practical purpose. These are answers to different questions, and the honest reading is that both are correct within their own frame.
What the pair demonstrates is that in body measurement research, method is not the boring part that precedes the findings. It largely is the finding. The Saudi cohort proved as much inside a single dataset: change nothing but the ruler's starting point and the average moves further than the whole disputed gap between two famous papers.
Which leaves readers in a better position than the arguments suggest. You do not need to referee between studies. You need to notice what each one did, and to hold any single figure a little more loosely than the headline invites. That is not scepticism as a posture. It is just reading carefully — and it is the difference between consuming research and understanding it.
Reader questions
Disclaimer
- All content on this website—including articles, educational materials, and interactive calculators—is for informational, educational, and entertainment purposes only. The calculations, percentiles, and outputs generated by tools on this site are based on general statistical data and mathematical models; they do not constitute medical data, a clinical assessment, or a diagnosis.
- Nothing contained on this website is a substitute for professional medical advice, diagnosis, or treatment. Always seek the guidance of a qualified healthcare professional or urologist with any questions you have regarding physical development, anatomy, or health conditions. Reliance on any information or tools provided by this website is solely at your own risk.
