


 English
 Español


A percentile is a rank, not a rating. That single sentence does more work than anything else on this page, because almost every misunderstanding that follows a session with the male size percentile estimator comes from reading a rank as though it were a score. A percentile tells you what share of a reference population measured below the number you entered.
It does not tell you whether that number is good, adequate, or cause for concern, and it cannot tell you anything at all unless the number you typed in was produced the same way the reference numbers were.
That last condition is where most people come unstuck. Below is what to enter, how the tool arrives at its answer, and — the part that gets skipped — the specific things a percentile result cannot tell you.
Before you start
Three minutes, one rigid ruler, and a decision about which measurement you are actually reporting.
| Do Use a rigid ruler, not a cloth tape, for length. Measure along the top surface. Record the protocol you used. Repeat on three separate occasions and use the median. | Don't Mix a bone-pressed length with a non-bone-pressed reference set. Enter a remembered figure. Measure once and treat it as fixed. Compare a girth percentile to a length percentile. |
Educational reference only. This page does not offer medical advice, diagnosis, or treatment guidance of any kind.
Step one: decide which measurement you are entering
Research on male genital dimensions does not report one number. It reports several, and they are not interchangeable. The systematic review most percentile tools are built from — Veale and colleagues' 2015 analysis in BJU International, pooling data on up to 15,521 men — reported five separate measurements, each with its own sample and its own average.
Two terms need defining before anything else, because they account for more confusion than every other variable combined.
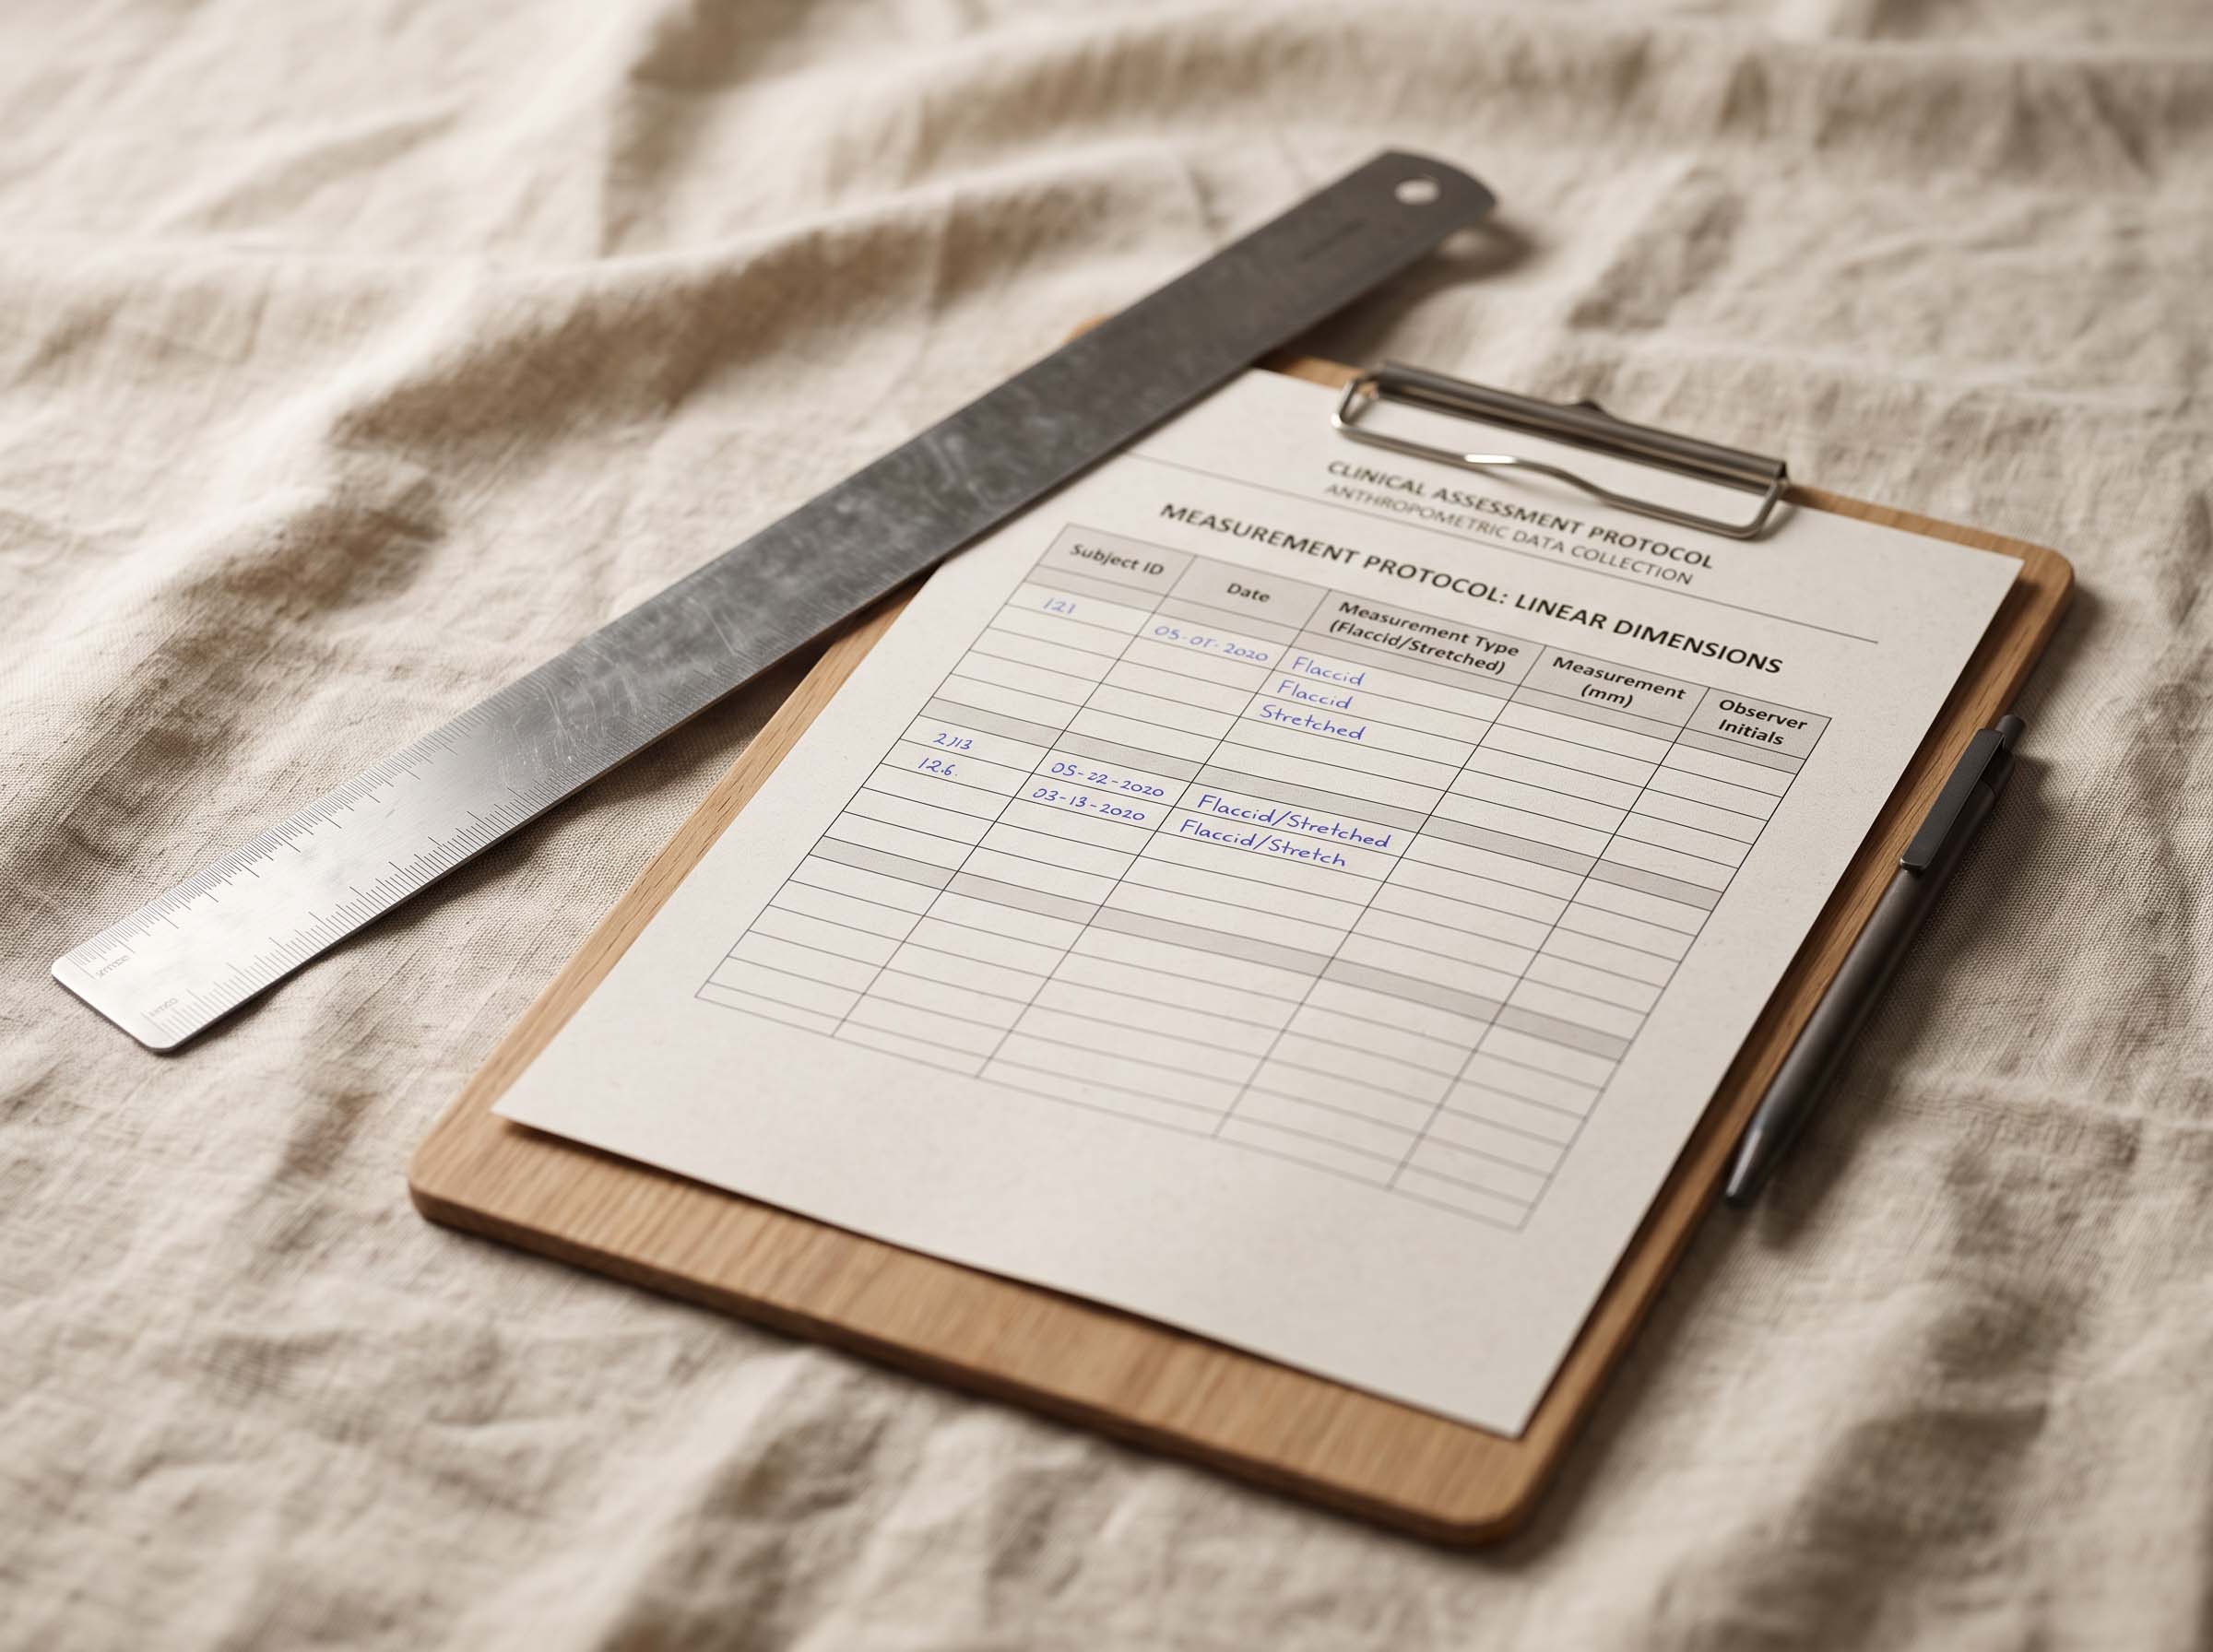
Bone-pressed (BP) means the ruler is pressed firmly against the pubic bone at the base before the reading is taken, compressing any overlying soft tissue. Non-bone-pressed (NBP) means the ruler rests on the surface at the base. The same body, measured both ways, produces two different numbers, and the gap widens as body mass increases. Clinical studies overwhelmingly use bone-pressed measurement, because it is the more repeatable of the two. Numbers exchanged informally are usually non-bone-pressed. Entering an NBP figure against a BP reference set will place a man lower on the curve than his own anatomy warrants — an error of method, not of body.
Stretched flaccid length (SFL) is the third term worth knowing. The flaccid organ is drawn out to firm resistance and measured. Researchers adopted it because it is far easier to obtain in a clinic than an erect measurement, and because it correlates reasonably well with erect length. It is a proxy, not a substitute — a point the numbers below make plain.
Step two: understand the reference population behind the curve
A percentile is meaningless without a stated reference population — the specific group of measured men the calculator is comparing you against. Three published datasets, all peer-reviewed, all methodologically defensible, sit side by side below. They do not agree, and the reasons they disagree are entirely procedural.
| Study | Sample | Who measured | State measured | Reported mean |
|---|---|---|---|---|
| Veale et al., 2015 (pooled review of 17 studies) | Up to 15,521 men | Health professionals, standard procedure | Stretched flaccid (n=14,160) | 13.24 cm / 5.21 in (SD 1.89) |
| Veale et al., 2015 — erect subset | 692 men | Health professionals | Erect length | 13.12 cm / 5.17 in (SD 1.66) |
| Söylemez et al., 2012 (Turkey) | 2,276 young men | Single research team | Stretched flaccid | 13.98 cm / 5.50 in (SD 1.58) |
| Habous et al., 2015 (Middle East) | 778 men | Experienced urologists | Erect, pharmacologically induced, bone-to-tip | 14.34 cm / 5.65 in (SD 1.86) |
| Herbenick et al., 2014 (USA) | 1,661 men | Self-measured at home | Erect, self-reported | 14.15 cm / 5.57 in (SD 2.66) |
Read down the right-hand column and the spread looks like disagreement about male bodies. Read down the two middle columns and it resolves into disagreement about procedure. The Habous team induced erections pharmacologically and measured bone-to-tip in a clinical setting; that protocol produced the highest clinician-measured figure in the table. The Herbenick figure came from men measuring themselves at home for the purpose of ordering a correctly sized condom — a context designed to reward accuracy — and it still landed roughly a centimeter above the pooled clinician-measured mean, with a standard deviation more than half again as wide.
Standard deviation (SD) is the number to watch. It describes how tightly the measurements cluster around the average, and it is what converts a raw measurement into a percentile. A wider SD flattens the curve and pulls every result toward the middle. The self-report dataset has an SD of 2.66 cm against the clinician-measured 1.66 cm — which means an identical measurement can land at meaningfully different percentiles depending on nothing but which dataset the calculator was built on. Our companion piece on how study design shapes what research reports works through this arithmetic in detail.
The studies do not disagree about male bodies. They disagree about procedure — and a percentile inherits every one of those disagreements.
Step three: read the output
The estimator returns a percentile: a number between 1 and 99 describing the share of the reference population that measured below your entry. A 60th-percentile result means roughly 60 out of every 100 measured men in that dataset fell below the figure you entered. It carries no other information.
Two features of the curve are worth understanding before you read your own number.
The first is compression at the center. Because human measurements cluster tightly, small differences near the middle of the distribution translate into large percentile jumps. Using the pooled erect figures, a difference of a single centimeter around the average moves a result across roughly twenty percentile points. The reverse holds at the edges: out past the 90th percentile, a full centimeter buys only a few points. A percentile is a rank in a queue, and the queue is densest in the middle.
The second is measurement error. Two trained clinicians measuring the same man do not always agree; the Habous team documented interobserver variability running to double-digit percentages. If professionals working to a written protocol vary that much, a home measurement taken once, at one time of day, in one room temperature, carries an error band wide enough to swallow several percentile points on its own. This is the practical case for measuring three times on separate occasions and using the middle value.
Figure 1
Where percentiles sit on the curve — modelled on the pooled erect length distribution reported by Veale et al. (2015): mean 13.12 cm, SD 1.66 cm.
Hover any point to read the measurement and its approximate percentile. The curve is a statistical model of the published distribution, not a measurement of individuals.
What the number cannot tell you
Four limits are structural, and no amount of careful measuring removes them.
The erect reference sample is small. The pooled review's stretched-flaccid nomogram rests on 14,160 men. Its erect length nomogram rests on 692, and its erect circumference nomogram on 381. An erect percentile is therefore a rank against a few hundred men, not fifteen thousand — a fact rarely printed beside the output of any online tool. Our breakdown of that study covers the sampling in full.
The proxy is not the thing. Stretched flaccid length is used because it is practical, not because it is equivalent. Working with 778 men, the Habous team found that stretched flaccid measurement underestimated erect length by an average of 2.64 cm — about 21 percent. A percentile derived from a stretched flaccid entry is a rank among stretched flaccid measurements and nothing more.
The reference population is narrow. The pooled dataset drew disproportionately from studies conducted in particular regions and clinical settings, a limitation the authors acknowledged. A percentile is only ever a rank against the men who happened to be measured, and no published dataset yet represents the global male population in proportion.
A rank is not an assessment. Research on male body image has repeatedly found that self-perception and measured reality diverge, and that men who report the most distress about size are frequently within the studied range. If a number is producing anxiety rather than curiosity, the useful conversation is with a qualified professional, not a calculator. Our article on why men fixate on measurements examines that research.
Did you know?
The 2015 systematic review that underpins most percentile tools was titled with a question rather than a claim: Am I normal? Its authors stated plainly that the purpose of the nomograms was to reassure men whose measurements fell within the studied range — the research was designed as an answer to anxiety, not as a scoreboard.
The measurement nobody standardized: female anatomy
Male measurement is inconsistent. Female measurement is barely charted at all, and that gap is itself one of the more revealing findings in the field.
For decades the reference point most often cited was a 2005 study in BJOG by Lloyd and colleagues, which measured 50 women and reported ranges so wide that the authors' stated conclusion was the absence of a single typical form. Fifty women. The male pooled review, by contrast, drew on more than fifteen thousand.
The largest single-center dataset arrived only in 2018, when Kreklau and colleagues published measurements from 657 women aged 15 to 84 in the same journal. They recorded labia, clitoral, introital and perineal dimensions, and found that several measurements correlated inversely with age and variably with body mass index — meaning any percentile for female anatomy would need to be age-banded to mean anything, a refinement male tools rarely apply either. The authors described their own data as a baseline for one demographic group, not a universal standard.
A 2021 review by Hayes and Temple-Smith surveyed the available normative datasets for female genital anatomy and found them few, small, and methodologically inconsistent — measured by different people, at different anatomical landmarks, in different populations. Later work in Indian and South Indian cohorts has begun filling regional gaps, and the reported ranges remain wide: labia minora length spanning several centimeters between the smallest and largest recorded values within single studies. Our survey of the documented range in published research sets out those figures.
The consequence for anyone using the female percentile estimator is straightforward: the reference populations are smaller, more regionally narrow, and less procedurally consistent than the male equivalents. The tool is honest about that. The absence of standardization is not a flaw in the calculator; it is the state of the published evidence.
Why the field never agreed on one protocol
Attempts at standardization go back further than most readers expect. Researchers proposing reference ranges in the 1990s were already noting that comparison across studies was frustrated by inconsistent technique. The pooled 2015 review addressed the problem by screening thousands of publications and admitting only those in which measurement was performed by a health professional using a standard procedure — a filter that eliminated the great majority of the literature.
Three forces have kept full consensus out of reach. Access is the first: erect measurement in a clinical setting requires either pharmacological induction or an unusually cooperative protocol, and most research budgets accommodate neither, which is why the stretched flaccid proxy dominates. Ethics review is the second, since the least invasive procedure is generally the one approved. Purpose is the third and least discussed — a urologist establishing surgical reference ranges, a condom manufacturer sizing product, and an epidemiologist tracking population trends each need a different measurement, and each will reasonably choose a different protocol.
None of this means the research is worthless, and treating methodological variation as grounds for dismissing all findings is its own error. It means the reference set must be stated. A percentile accompanied by its source dataset, its protocol, and its sample size is a genuinely useful piece of information. The same percentile presented as a bare number is decoration. Our guide to measurement technique covers the procedural side in full.
Using the result well
The people who get the most out of a percentile tool tend to use it once, in the way a person checks a height chart: measure carefully, note the protocol, read the rank, understand the reference set, and close the tab. The people who get the least out of it measure repeatedly, chasing a number, entering figures obtained under changing conditions and treating the variation as signal.
A percentile is a description of where one measurement sits among other measurements taken the same way. Given a stated protocol and an honest reference set, that is a real piece of information about the distribution of human bodies. Given neither, it is arithmetic performed on an unknown.
Editorial glossary
- Percentile
- The share of a reference population that measured below a given value.
- Nomogram
- A chart plotting the full distribution of a measurement, from which percentiles are read.
- Reference population
- The specific measured group a percentile compares an entry against.
- Bone-pressed (BP) / non-bone-pressed (NBP)
- Whether the ruler is pressed to the pubic bone at the base, or rests on the surface. The two are not interchangeable.
- Stretched flaccid length (SFL)
- A flaccid measurement taken under gentle extension, used as a practical proxy for erect length.
- Standard deviation (SD)
- How tightly measurements cluster around the average. A wider SD flattens the curve.
- Pooled mean
- An average combining several studies, weighted by sample size.
- Interobserver variability
- The disagreement between two trained people measuring the same subject.
Common questions about percentile results
Sources
Veale D, Miles S, Bramley S, Muir G, Hodsoll J. Am I normal? A systematic review and construction of nomograms for flaccid and erect penis length and circumference in up to 15,521 men. BJU International. 2015;115(6):978–986.
Habous M, Muir G, Soliman T, et al. Erect penile dimensions in a cohort of 778 Middle Eastern men: establishment of a nomogram. Journal of Sexual Medicine. 2015.
Herbenick D, Reece M, Schick V, Sanders SA. Erect penile length and circumference dimensions of 1,661 sexually active men in the United States. Journal of Sexual Medicine. 2014;11(1):93–101.
Söylemez H, Atar M, Sancaktutar AA, et al. Relationship between penile size and somatometric parameters in 2276 healthy young men. International Journal of Impotence Research. 2012.
Lloyd J, Crouch NS, Minto CL, Liao LM, Creighton SM. Female genital appearance: 'normality' unfolds. BJOG. 2005;112(5):643–646.
Kreklau A, Vâz I, Oehme F, et al. Measurements of a 'normal vulva' in women aged 15–84: a cross-sectional prospective single-centre study. BJOG. 2018;125(13):1656–1661.
Hayes JA, Temple-Smith MJ. What is the anatomical basis of labiaplasty? A review of normative datasets for female genital anatomy. Australian and New Zealand Journal of Obstetrics and Gynaecology. 2021;61(3):331–338.
Disclaimer
- All content on this website—including articles, educational materials, and interactive calculators—is for informational, educational, and entertainment purposes only. The calculations, percentiles, and outputs generated by tools on this site are based on general statistical data and mathematical models; they do not constitute medical data, a clinical assessment, or a diagnosis.
- Nothing contained on this website is a substitute for professional medical advice, diagnosis, or treatment. Always seek the guidance of a qualified healthcare professional or urologist with any questions you have regarding physical development, anatomy, or health conditions. Reliance on any information or tools provided by this website is solely at your own risk.


